


Warranty claims make up less than 3% of sales for most HVAC distributors. Yet a single claim can touch up to six departments, eat 15–20 minutes of counter time, and cost more than $200 in manual labor before the manufacturer credit ever arrives.
Using benchmark data from APQC, this report breaks down where those labor costs hide, what top-quartile performers do differently, and how to estimate the ROI of automating warranty processing at your own claim volume.
Get the complete breakdown of how warranty friction impacts your bottom line and how to fix it.
Download the full industry report
Why Warranty Is HVAC Distribution's Most Disruptive Transaction
Most supply chain transactions have gone digital. Warranty hasn't. It remains low-volume, high-impact work that pulls people away from revenue-generating tasks:
- Low volume, high impact: Under 3% of sales, yet a claim touches up to 6 departments.
- Labor intensive: Each manual claim takes 15–20 minutes at the counter, plus follow-up and rework.
- Coordination nightmare: High coordination costs, constant rework, and delayed credits create workflow chaos. One claim can feel like a company-wide project.
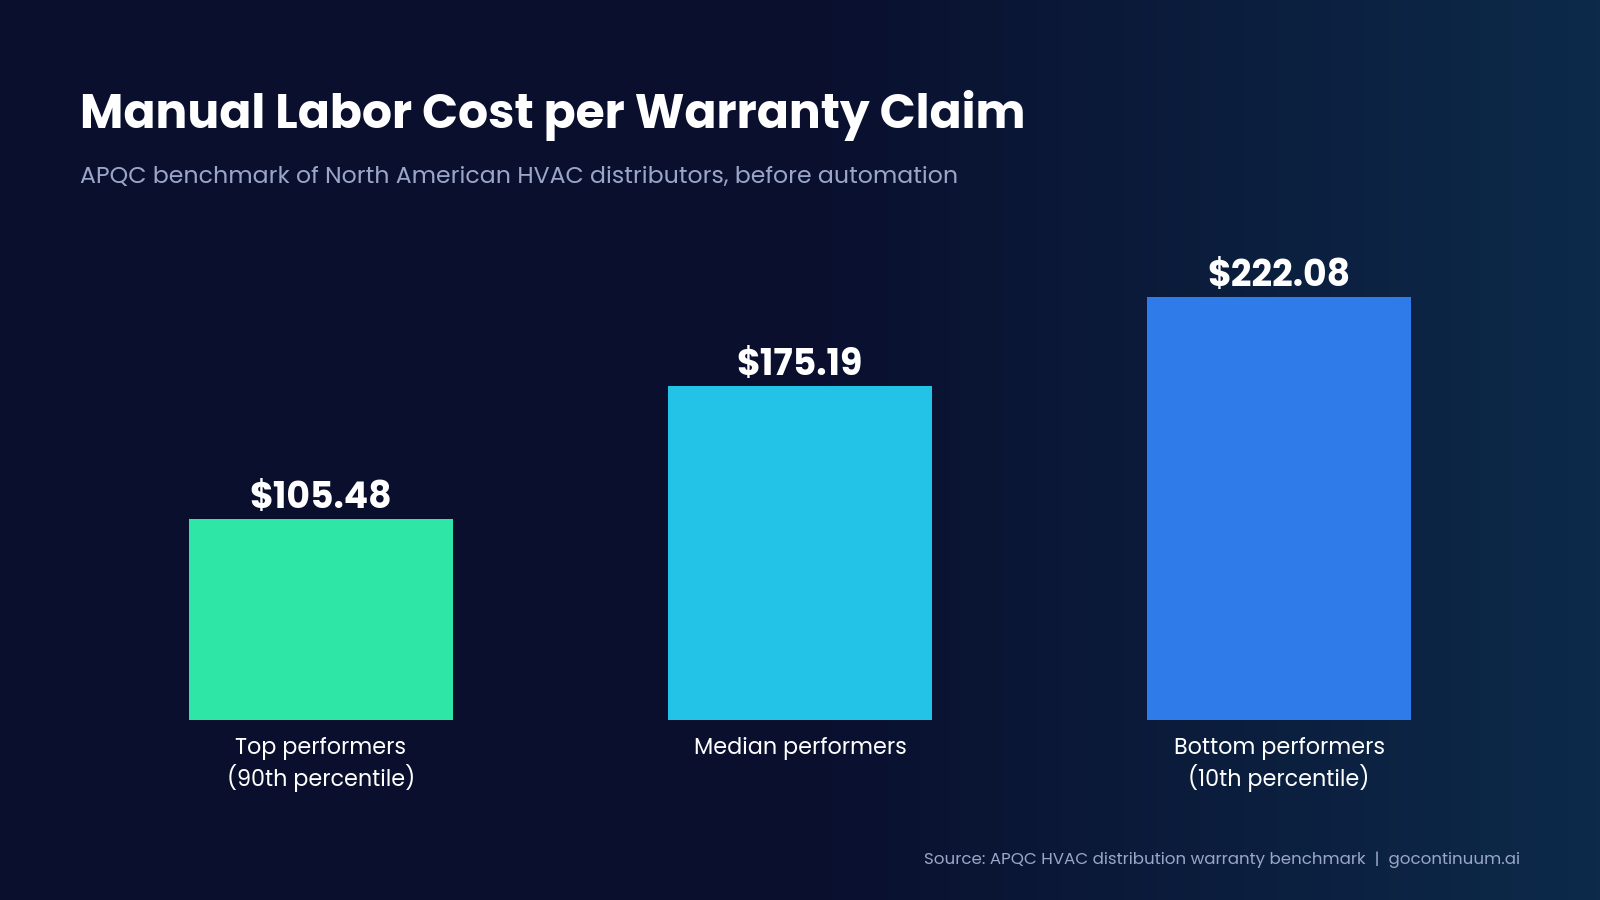
APQC analyzed warranty data from North American HVAC distributors, before automation was added to the process, and found the fully loaded manual labor cost of a single claim ranges from about $105 for top performers to $222 for bottom performers.
Where the Labor Cost Hides
APQC data suggests distributors lose hundreds of staff hours to warranty processing each year. The cost builds across five areas:
- Counter time: 15–20 minutes per claim to gather data, verify serials, and complete forms.
- Multi-touch workflow: 3–6 employees re-enter or check the same data across departments.
- Error loops: 40% of claims need correction, adding 10–15 minutes of rework each.
- Finance lag: Manual reconciliation delays manufacturer credits by about 30%.
- Customer follow-ups: Customers chase warranty status and credit clarification, creating low-value work.
The APQC Performance Gap
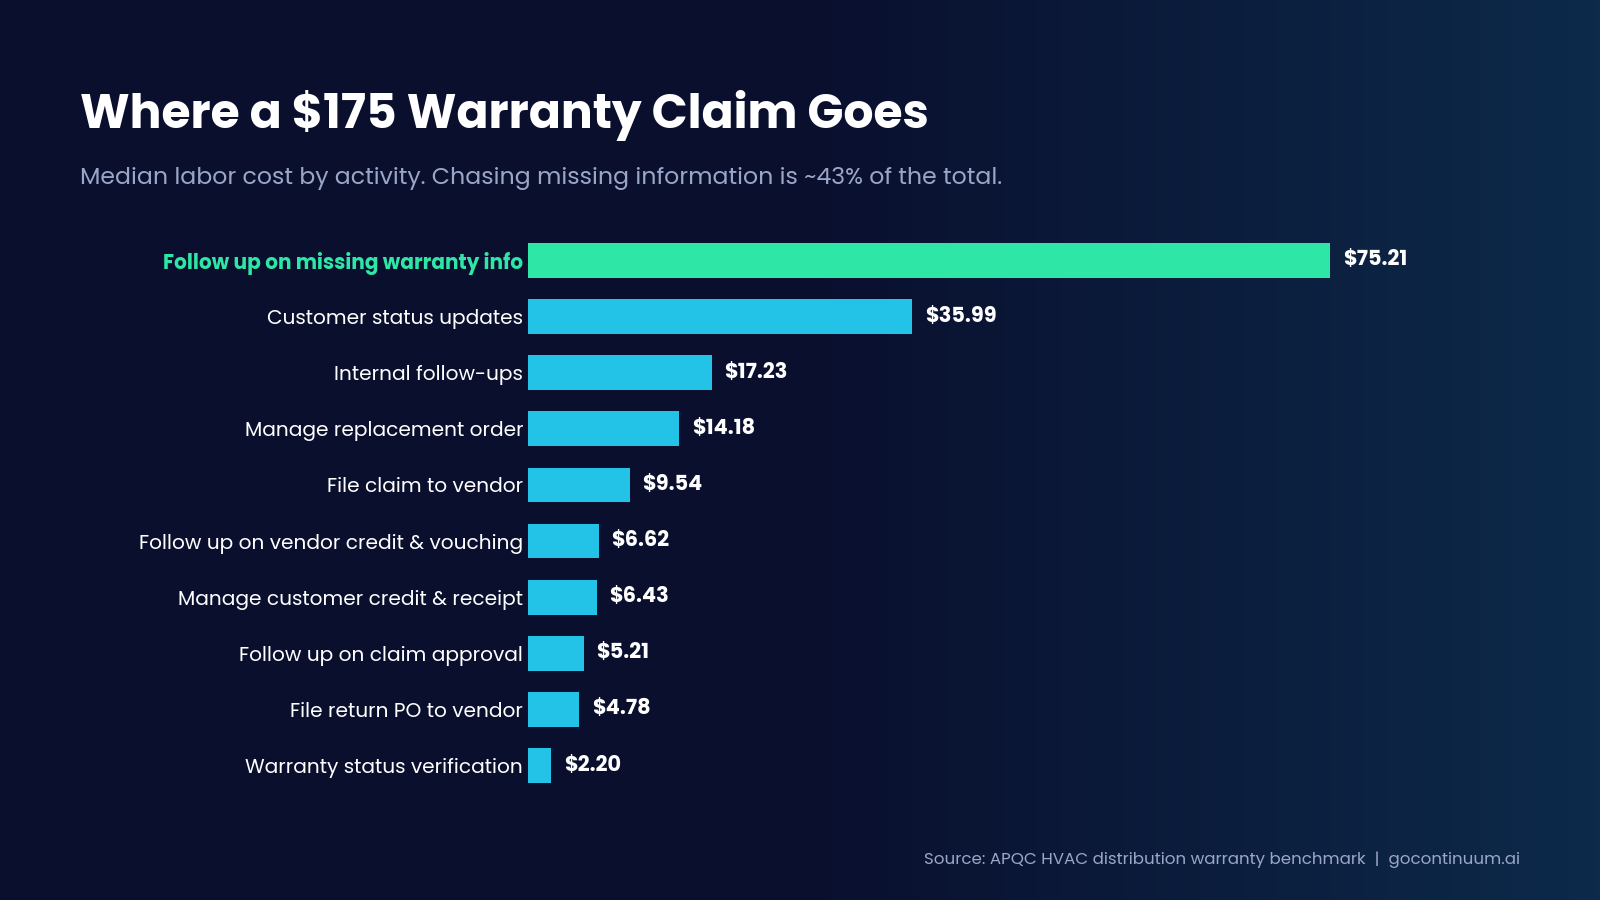
The biggest single cost driver isn't filing the claim. It's chasing what's missing. Following up on missing warranty information accounts for nearly half the total labor cost of a claim: $75.21 per claim for the median distributor and $92.82 for bottom-quartile performers. What starts as an incomplete claim at the counter becomes a costly cycle of calls, emails, delays, and stalled vendor credits.
| Activity | Top quartile (90%) | Median (50%) | Bottom quartile (10%) |
|---|---|---|---|
| Warranty status verification | $1.03 | $2.20 | $3.12 |
| Manage replacement order, incl. item ID and availability | $11.13 | $14.18 | $17.89 |
| Manage customer credit and receipt | $5.06 | $6.43 | $9.74 |
| File claim to vendor, incl. serials and defect details | $4.01 | $9.54 | $14.72 |
| File return PO to vendor | $2.25 | $4.78 | $8.14 |
| Follow up on vendor credit and vouching | $4.18 | $6.62 | $8.09 |
| Follow up on claim approval | $3.87 | $5.21 | $7.52 |
| Follow up on missing warranty info | $51.01 | $75.21 | $92.82 |
| Customer status updates | $11.79 | $35.99 | $41.54 |
| Internal follow-ups | $12.18 | $17.23 | $21.62 |
| Total per claim | $105.48 | $175.19 | $222.08 |
Source: APQC benchmark of North American HVAC distributors (approx. 2,000 branches studied).
The Economic Impact
- Hidden SG&A drain: Labor spent on non-revenue tasks.
- Cash flow drag: Slow credit reimbursements strain working capital.
- Customer friction: Contractors wait 20 minutes for claim entry.
- Margin erosion: Processing costs run 25–30% higher than automated peers.
Top-Quartile Benchmark: What "Good" Looks Like
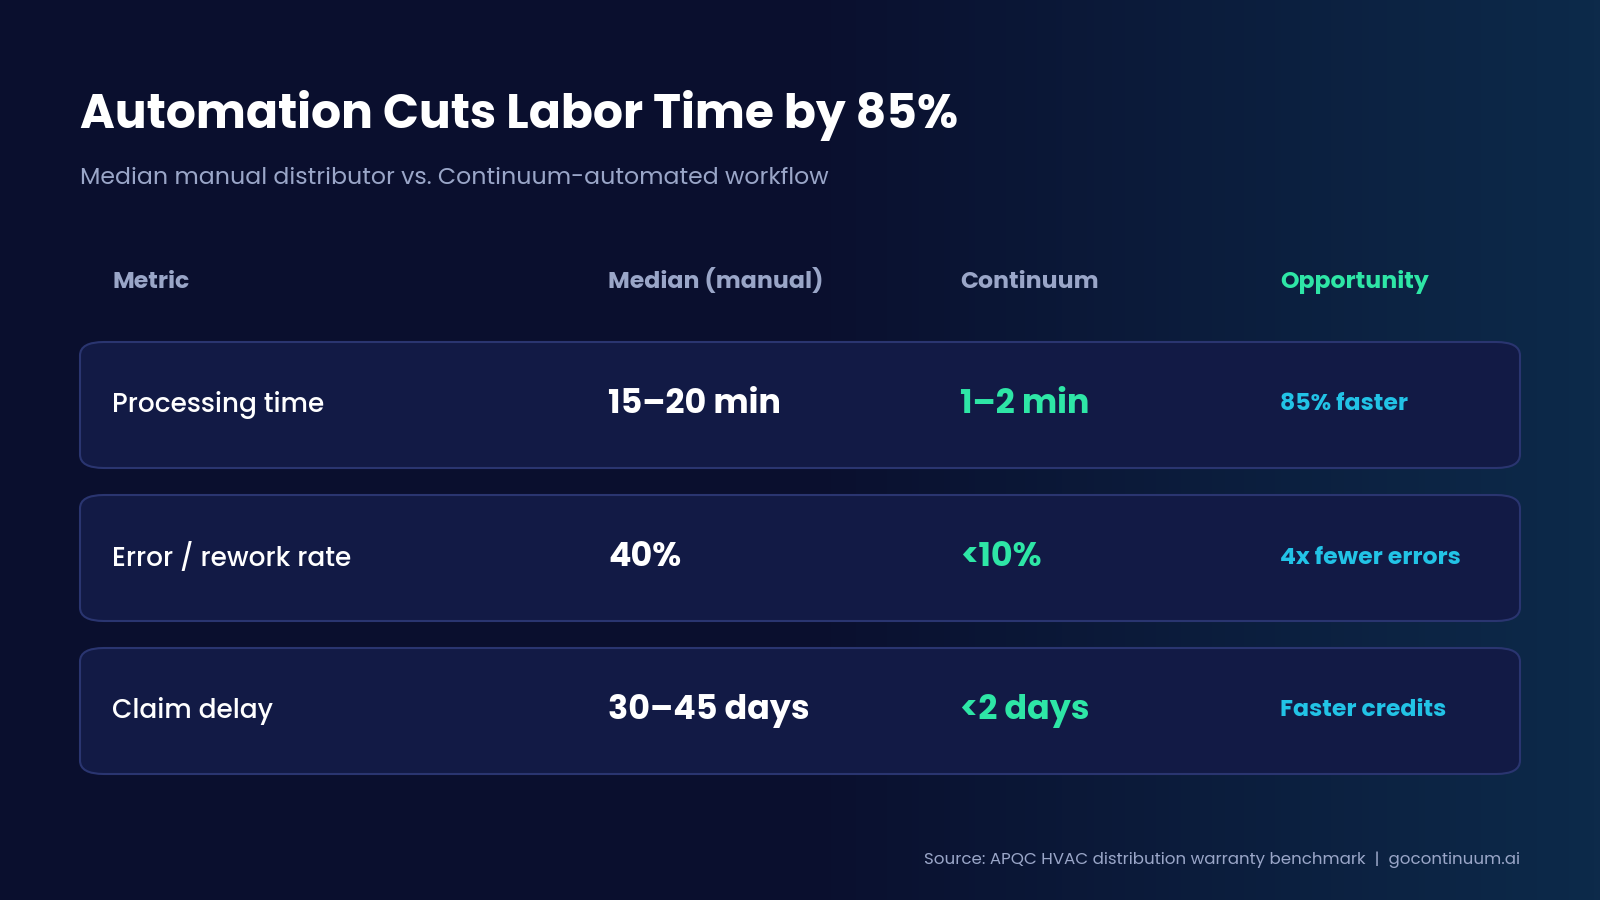
Automated performers in the APQC dataset lead on every key metric: 70–80% less admin time, near-zero errors versus 40% for manual processing, and roughly 30% shorter reimbursement cycles. That median-to-top-quartile gap defines the automation ROI window, and higher post-claim NPS shows the customer experience lift.
With automation, labor time per claim drops by 85%:
How to Estimate Automation ROI for Your Claim Volume
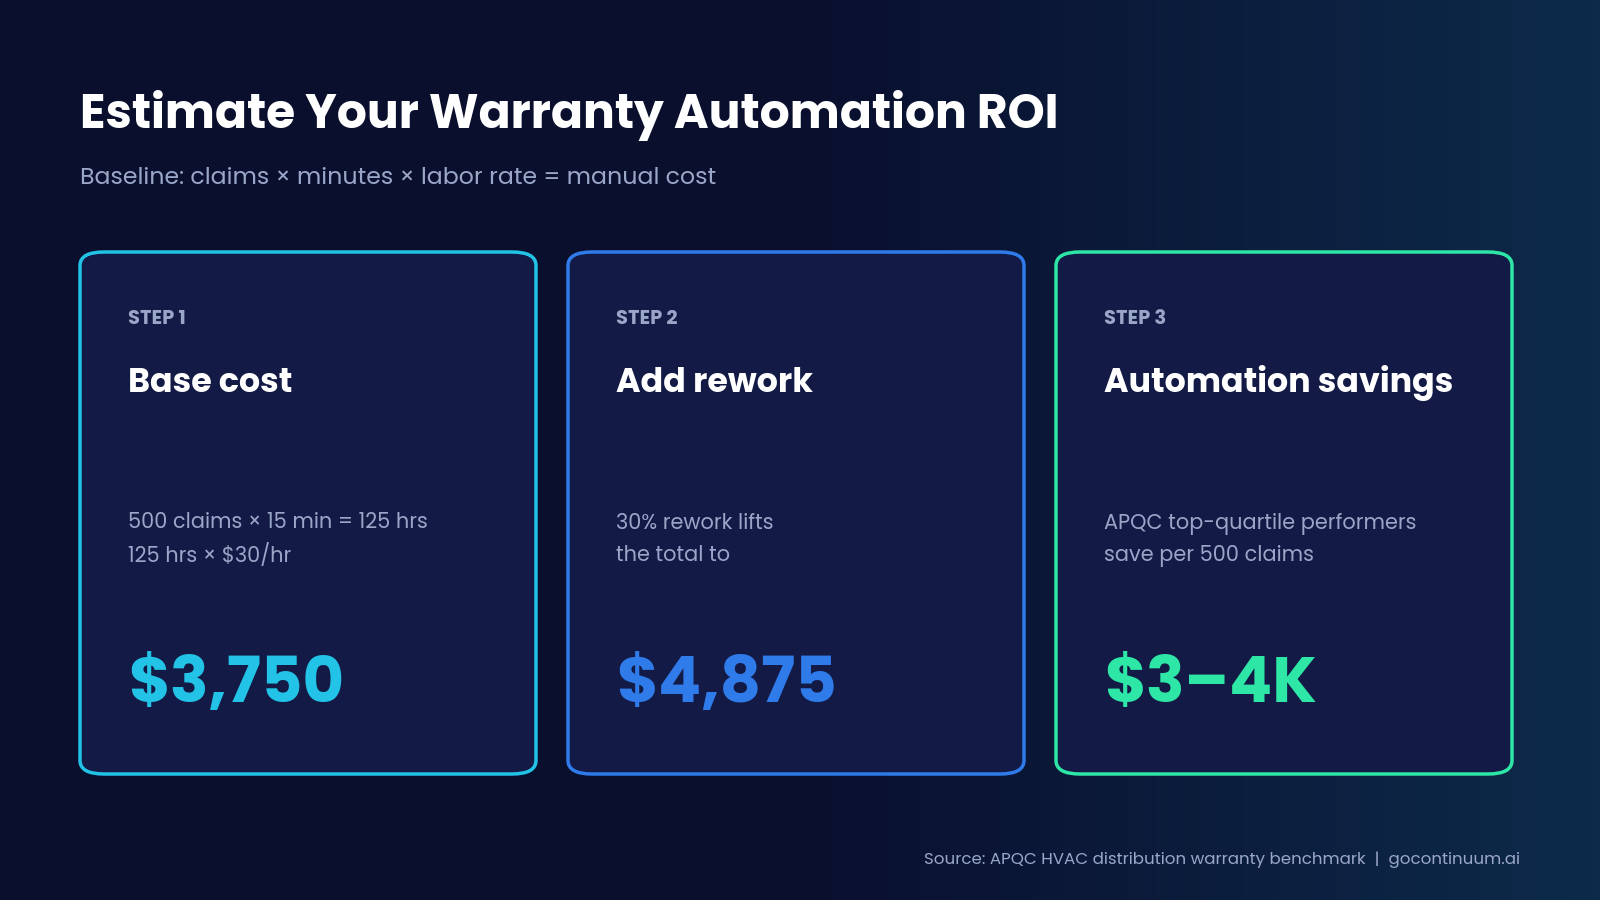
Start with a simple baseline: claims × minutes × labor rate = manual cost.
- Base cost: 500 claims × 15 minutes = 125 hours × $30/hour = $3,750.
- Add rework: 30% rework lifts the total to $4,875.
- Automation savings: APQC top-quartile performers save $3,000–$4,000 per 500 claims.
The Cost of Doing Nothing
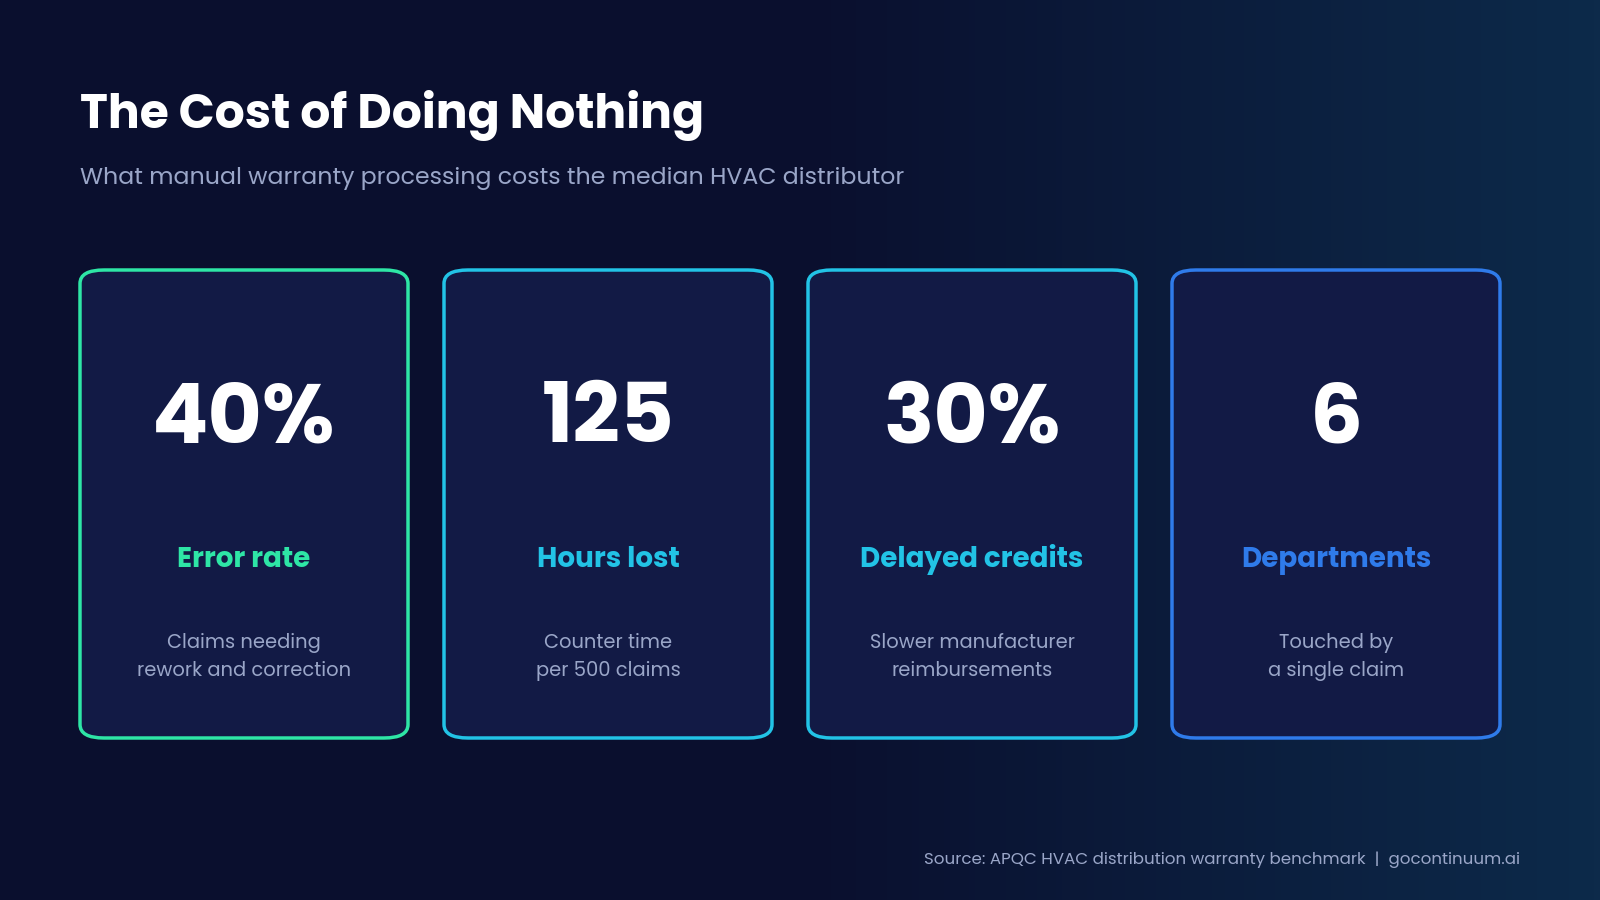
Staying manual has a measurable price: a 40% error rate, 125 hours lost per 500 claims, credits delayed by 30%, and six departments pulled into every claim.
"Sometimes it takes two days and sometimes it takes a year and a half to get the credit back… and we're talking millions of dollars of warranty every year."
— President, Mid-Size Distributor
Strategic Takeaways for Executives
- Disproportionate impact: Warranty uses heavy labor for little revenue.
- Clear business case: APQC benchmarks make the cost easy to prove.
- Clear solution path: Automation is the lever that lifts performance.
From Manual to Automated
Continuum turns the APQC top-quartile benchmark into results:
- Processing time: 60 seconds, down from 15–20 minutes.
- Labor cost: 70–80% lower than manual processing.
- Errors: Near zero, with automated validation.
- OEM credits: Faster reimbursement cycles.
"The aha moment was telling my team we can do a warranty in 60 seconds, start to finish. Before Continuum, the average counter guy would take 15–25 minutes to process a claim."
— Alexander Garrido, Area Manager, Tropic Supply
Quantifiable Margin Recovery
For HVAC distributors, this isn't just digital transformation. It's margin recovery you can measure. Manual processes cost you both time and money. With Continuum, you can automate like top performers: cut processing time by 85%, reduce errors to near zero, and improve profitability.
View the complete breakdown of how warranty friction impacts your bottom line, and how to fix it. [Download the full report]

Comments